Network-Monitoring (PRTG): Benefits and Examples
Our main task as those responsible for sound is actually “good sound”. We want to convey what is happening on stage to our audience in an acoustically appealing way. Depending on the situation, this can range from a simple “the language was easy to understand” to “the music moved/inspired me.”
Technology has always been a means to an end. While computers and network technology initially simplified certain things, they are now an elementary part of a sound system. Many theaters that I have looked after in recent years are now based on AoIP, in most cases Dante. This means that not only control signals or file transfer run via switches, but also our most fundamental asset: the pure audio signal.
In the event of a network disruption, this sometimes means: silence. And not just for the sound engineer in his studio or the musician on stage. Silence quickly affects the entire hall. A performance may have to be interrupted or ended completely.
Today I would like to present to you my experiences on the subject of network monitoring. Technical defects in an audio system occur again and again over the years. However, through quick detection and precise fault localization, these can be eliminated long before they become noticeable in the form of an audio failure.
Typical Network Problems
Defective cable connections or SFP modules
This is by far the most common cause of errors. Depending on the quality standard of the cable and daily use, it can easily happen that a plug no longer works properly. The same applies to SFP modules. Cheap third-party products usually don't last as long as the originals from Cisco etc.
Replacements usually don't cost much. And you usually have a few copies of all the cables and modules lying around anyway. Troubleshooting can usually be carried out quickly and easily - once you are aware of the problem.
Redundancies can be provided at many points in a switch network. A failure of a cable or SFP module is seamlessly compensated for by a redundant connection so that the event is not endangered. However, it is all the more important that defective connections are repaired promptly. Otherwise, the system will only run on the (possibly last) redundancy connection and any further cable problems will actually lead to an audible loss of sound.
A network monitor can monitor each individual port of a switch individually. In the event of an error, you can see at a glance which connection is down based on the sensor list or, ideally, on a clear map.
For me, the priority for monitoring is always the uplink ports, i.e. the connections between the switches. These are usually completely transparent for the sound engineer. A failure only becomes noticeable when it is actually too late.
Devices switched off / defective
Port monitoring of the devices is similar to monitoring the uplink ports between switches. A failure usually becomes noticeable quite quickly because, for example, a device no longer delivers audio. Nevertheless, it is helpful to monitor the most important devices as well. The error message then occurs immediately, and not just when the device is needed. It also helps with clarity if all monitoring is combined in a single software. You can immediately see any potential problems when you start the service and you don't have to open and look through various product software (such as Dante Controller, Amp Controller, etc.).
Switch defective
An error that occurs extremely rarely, but can nonetheless happen: a switch is completely defective. In such a case, the network monitor no longer receives any information from this switch. All sensors that were created on the switch are therefore displayed as errors.
Too much traffic
Every network port on a switch has a maximum data rate, as does every device. 1Gb ports are currently the most widespread. 100Mbit ports are in the minority, but they are still found in new devices. For example, many Dante devices with only 1-2 channels use Audinate's Ultimo chip, which only offers 100Mbit/s.
When traffic on a port approaches its limit, problems quickly arise. Some data packets are lost, so that delays sometimes occur in the control area. In the audio area, the buffer is very small. Lost packets usually mean audio dropouts or audible distortion. You should therefore always keep an eye on the current traffic.
Each switch typically offers the ability to view traffic for each port on its web interface. However, this is a very complex process of clicking through all the switches and ports. It is much more convenient and time-saving to create sensors for the most important switch ports in your network monitoring and, if possible, to display them as a map.
A common scenario in Dante networks is excessive multicast traffic. Dante devices with Ultimo chips quickly become overloaded and then usually switch to mute. IGMP snooping would be a solution, but it needs to be implemented carefully in all switches. Any errors (still high traffic) can be localized very quickly through network monitoring.
Incorrect switch settings
At the latest when you operate not just one but several switches, settings in the switches play a crucial role. A few examples of settings that need to be defined and coordinated for all switches:
Spanning Tree (STP on/off, which protocol, for MSTP: name/revision/VLAN mapping, priority per switch/instance)
IGMP snooping (on/off, which VLANs)
IGMP Querier (which/all switches, which VLANs)
QoS (on/off, mode, which DSCP on which queue)
SmartPort / AutoTrunk (on/off)
EEE (on/off)
Switchport mode (Trunk/Access)
Over time, different technicians may gain access to the switches and knowingly or unintentionally change things. In the simplest case, one switch is exchanged for another due to a defect or because a larger model with more ports is needed. It is not uncommon for the exchange to be carried out quickly and the general functions work again. However, if elementary settings are not restored carefully, this can quickly mean that, for example, the redundancy no longer works in the way it was intended.
If network monitoring monitors certain parameters, any change is noticed immediately.
Topology changes
When designing a network, you usually have very precise ideas about which route traffic should take and which connections could be used as a failover. Ultimately, you want to ensure that you achieve optimal performance in your network (latency, load balancing). On the other hand, you want to be prepared for any possible defect and install redundant connections and sometimes even switches.
However, all of this can be ruined if foreign switches are added unnoticed. For example, if a third-party (or in-house) switch accidentally has a higher priority setting for STP, it takes over the function of the root bridge for the entire network. As a result, all uplinks between the switches are rebuilt and the previously desired traffic design is sometimes completely destroyed.
Monitoring the current root bridge (MAC address) on some switches immediately informs you if the switch intended for this purpose no longer takes over this task. In the case of MSTP, this can also be done per instance (provided the switch provides this information via SNMP).
Dante subscriptions / low traffic
Of course, a switch initially doesn't know exactly which traffic should flow through a port. The switch does not provide information such as that shown in the Dante Controller, such as which subscription a recipient receives.
Nevertheless, network monitoring can also be used to support a (static) Dante network. Devices such as amplifiers or radio receivers usually provide a very predictable number of channels and thus a constant data rate. For each port on a switch, a lower and upper threshold value could be easily defined in monitoring.
For example, if a Shure ULX4D consistently delivers around 4Mbit/s, a lower threshold could be set at 2Mbit/s. If this is not met, for example because the mixer cannot set up the subscription correctly, this will be displayed as a warning. Long before the acoustic sound check, it is clear if a receiver is not correctly integrated into the network.

An upper threshold could be set at around 10Mbit/s. This would issue a warning if traffic on this port is too high, for example if multicast unexpectedly occurs in the network.
The same could be done for all Dante amplifiers, which also usually receive very consistent traffic.
Traffic varies for mixers and stageboxes with changing subscriptions. Monitoring is only possible to a limited extent or with a large threshold value.
Air conditioning broken, ventilation blocked
One area that initially has nothing to do with audio is temperature monitoring. Many switches now have a temperature sensor built in and can usually be accessed by external monitoring via SNMP.
Even if you can't tell at first glance whether 45 degrees Celsius is good or bad. With the help of network monitoring that queries and saves its values, for example, once a minute, a graph can be created for each switch. On the one hand, you can immediately tell if a switch generally delivers higher temperatures than identical switches in other rooms. On the other hand, you can clearly see how the temperature changes depending on the time of day. Switches in amp racks or in the ceiling above the auditorium may fluctuate by a few degrees when the amps are turned on or when the auditorium is full.

However, the most important information in the graphs can be quickly recognized as soon as the temperature moves above the usual range. The quicker you notify someone to repair your air conditioning system, the sooner everything will be back to normal and the less likely it is that a device will die from heat.
Even for rooms that you enter every day, such as the sound control room, it helps if you can see via network monitoring in the morning that the air conditioning has failed. The problem may be resolved by the time of the performance in the evening. Otherwise, you will only notice the defect when you enter the sound control room shortly before the sound check and then you may have to spend the performance in a sauna.
Of course, monitoring the temperature and reacting quickly to possible defects not only ensures the longevity of the switches, but of all devices in this room.
Other usecases
In addition to pure network devices, there are of course a variety of other devices that can also be monitored via SNMP.
The Nexus audio matrix from Stagetec provides not only the temperature but also other important information for each of their stage boxes. For example, you can query the number of active power supplies. As soon as a power supply is retired, operations continue seamlessly due to sufficient redundant power supplies. But ultimately you have to keep an eye on this and, in the event of a defect, repair or replace it at some point.
Another use would be to monitor the free storage space on a NAS in order to be aware when space is running out and you may need to order additional hard drives.
WAYS OF NOTIFICATION
Of course, the best monitoring is of no use if the team on site doesn't find out about the errors. Luckily, there are easy ways to not only view status, but even get notified. I have looked at various network monitoring options over the last few years and now work exclusively with PRTG Network Monitoring. In this respect, I will refer below to the functions of this one piece of software.
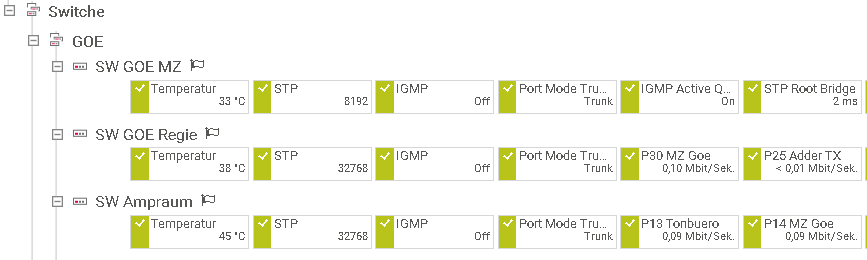
Sensor list
The hierarchy in PRTG essentially consists of groups (e.g. per stage or room), then of physical devices (each with an IP address), and finally of several sensors per device.
The corresponding device list is not only used to create devices and sensors, but also provides quick status feedback.
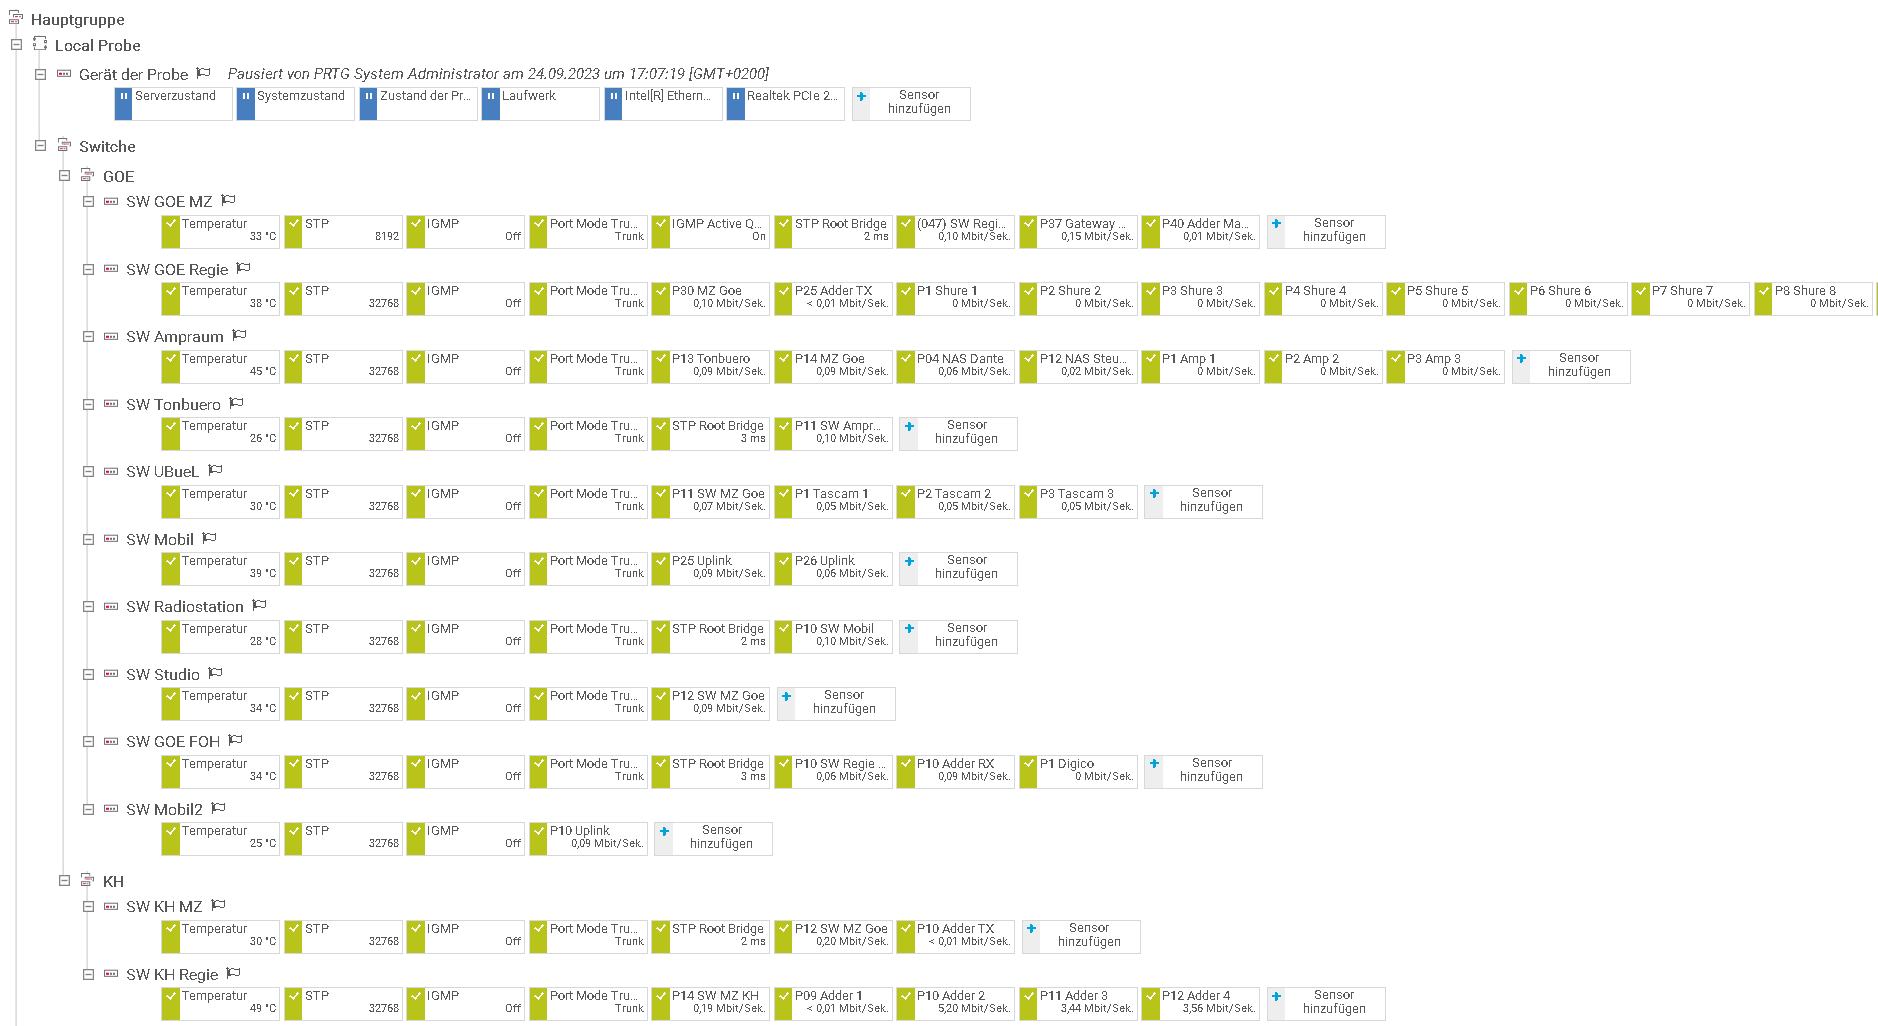
Sensors whose values lie within the entered threshold values are marked with a green tick. Each sensor also has two upper and lower threshold values. If this is undershot or exceeded, the sensor provides a warning (yellow) or error message (red).
In the simplest case, you leave your network monitoring with this list and already have all the information available.
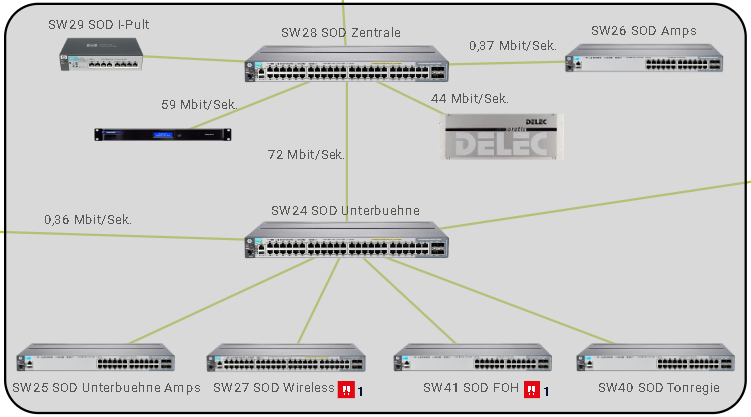
Map
Something more elegant and, above all, more understandable is the creation of an overview map. This doesn't actually offer any new information, but it offers a better representation of the topology through graphical processing. Any number of maps can be created in PRTG, so that different levels of detail can be shown for different employees or specialist departments. Or, in addition to an overall overview of all switches, a detailed map can be created for each stage with the individual devices.
Links make it easy to navigate back and forth between the maps, for example to quickly reach a separate page for the temperature graphs.
And each map can be shared publicly if necessary, so that it can be viewed via a web browser even without a PRTG login. I usually leave a bookmark in the browser for the PRTG overview page on all PCs in a theater so that every colleague can see, if necessary, whether everything is OK with the network or whether action is required at any point.
Notification
And if you don't want to have the network page open in your browser all the time, but still want to be aware of every error, you can have PRTG notify you by email. Rules can be created as to which type of error should be reported for which user/email. For networks that only affect one department (e.g. the sound department), it is sufficient to send any errors to the department admin or, if necessary, to the entire department. In normal operation, hardly anything should be sent here. And if an uplink port actually fails, it can't hurt if everyone notices.
Finally, the PRTG app should also be mentioned, which can also notify in the event of an error and also offers insight into the device list and maps. However, in order to be able to use this outside of the theater WLAN, the PRTG server must be publicly accessible.
COSTS AND EFFORTS
The good news first: PRTG Network Monitoring is available as freeware with 100 sensors for free (download link). And this version can be converted into a licensed version at any time later if necessary.
The smallest version after the freeware is the version with 500 sensors for USD 1899. I am only a user or external commissioner without any connection to PRTG. In this respect, I refer you to Paessler PRTG for details and procurement.
PRTG runs on a standard PC, which is likely to be available in every theater. The PC must have access to all switches. All sensors are polled approximately once per minute. Even with 500 sensors, this does not place a great strain on the CPU or the network. I would still recommend running the PRTG server on a pure “control PC”, not on a PC with performance-relevant audio playback or recordings . It is also recommended to leave the PC running permanently.
The basic setup of PRTG for a typical network with 10-15 switches, i.e. creating the devices and sensors, should be completed within a day. The prerequisite for this is of course that the network itself is already solidly configured. Network monitoring itself does not optimize the network, it only shows the status of the switches and ports.
Sensors such as ping or port traffic can be set up without much prior knowledge. However, for manufacturer-specific sensors such as temperature, spanning tree, IGMP etc., the exact OIDs for the respective parameter are required. Researching these can quickly take several hours, especially if you have no experience with SNMP.
Creating a graphical map usually takes longer than creating the sensors themselves. For a good overview (also for new employees or freelancers), it is recommended to take or download photos of the most important devices and integrate them into PRTG. If you know what you're doing, I would estimate the total effort to be around 3 days.
CONCLUSION
The short version: regardless of whether I'm setting up a new network or optimizing an existing one - I always install PRTG. And the 100 versions of the free version are easily enough for small networks with around 10 switches. This allows you to monitor not only the uplinks, but also some basic parameters of each switch and the most important devices.
As soon as the network becomes relevant to a performance - and I now see this in most theaters and opera houses - it is almost negligent not to keep an eye on your network on a daily basis. Just like you do a sound check to check your microphones and speakers, a network check should also be part of your daily routine.
Once set up, network monitoring takes over this important task on the fly. With a single glance at a (hopefully pretty) overview map, you can see the status of all switches and devices. Any problems are identified and displayed much earlier than if you only start dealing with your network after the sound has already disappeared.
And once you have an overview page of the current status quo, you can usually see which errors still exist in the network or which improvements can still be incorporated.
The advantage of central monitoring is that you don't have to open the dedicated software on your devices. Rather, network monitoring collects the status of all devices across manufacturers and, if necessary, across departments. A head of department or the employee responsible for technical maintenance can identify problems and react if necessary from his office, even while the rehearsal or performance is running and without needing access to the mixing console system for this status report.
I wouldn’t want to be without this “silent employee” and can warmly recommend it for any permanent installation.
Of course, I would be happy to help you set up the monitoring or the overall network design.
More Network / Dante articles:
PRTG Network Monitoring: Which switches support SNMP / PRTG?
PRTG Network Monitoring: How many sensors do I need?
Switch comparison: Cisco SG350 vs CBS350
Dante: Useful Dante switch features
Dante: When should I use multicast?
Dante: 5 things you should know about the Dante Virtual Soundcard